THM: Wireshark 101

Hey folks, in this article i’m gonna walkthrough tryhackme’s introductory room for wireshark, while understanding the basics of wireshark, and network analysis.
Room: Wireshark 101
Introduction
Wireshark is an open-source tool to monitor and analyze network traffic, it can activly monitor available networks and can create PCAPs (Packet capture files) in real-time. we can also open and analyze already captured PCAPs to detect unusual anomalies in network.
Installation
Installing the wireshark is very easy, I am covering installation for windows although installation process is very simple for all operating systems, you can get your binary from its official website Wireshark.org.
If you are using a debian based Linux distro, you can install wireshark with apt package manager using apt-get install wireshark, for other distros or OS you can check out installation guide on google.
For more information about Wireshark check out the Wireshark Documentation.
Windows installation
Download the installer binary and open it will ask to allow permissions to make changes, click on yes.

Click next, accept the license agreement and do next.

We don’t need to change anything just leave it by default and click next > next.

You can choose your installation directory default location is C:\Program Files\Wireshark, I’ll leave it default as well and click on next
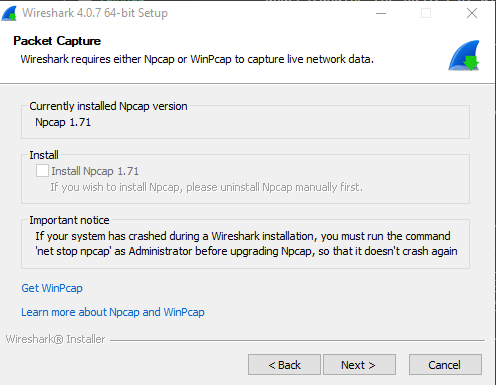
To capture live packets wireshark needs either winpcap or npcap both are network packet capture and monitoring libraries for windows based on libpcap library which is used for linux based systems.
I already have installed npcap on my windows system, select Install Npcap option anc click next.
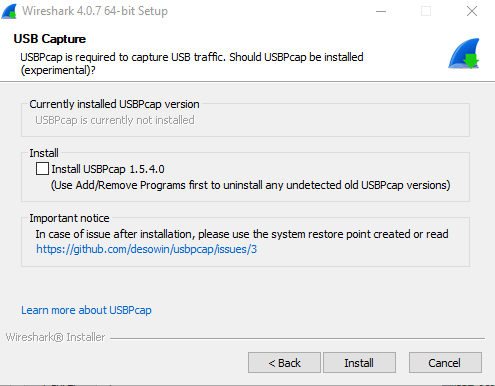
Wireshark also provide functionality to capture usb data, this is optional for now in this article we’ll focus on capturing only network packets, so just click on Install.
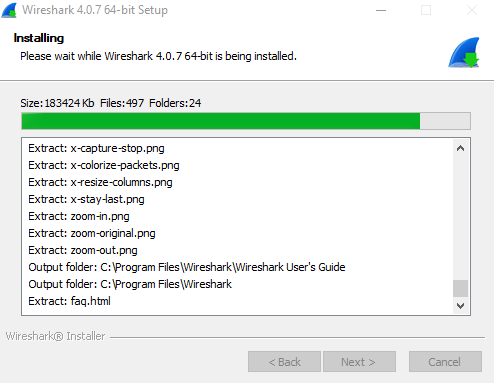
The installation process will take some time according to your system performance.

Our installation is completed, click on next and finish.
Wireshark Overview
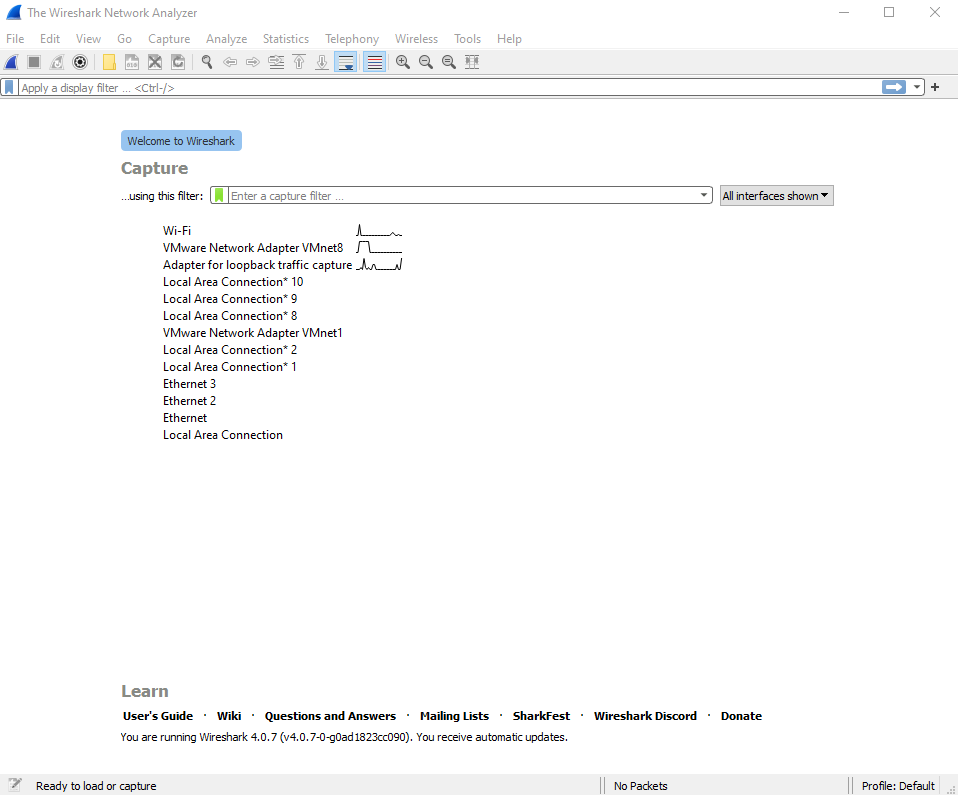
When we open wireshark for the first time, it looks like below image. This is wireshark’s main window.
Interfaces
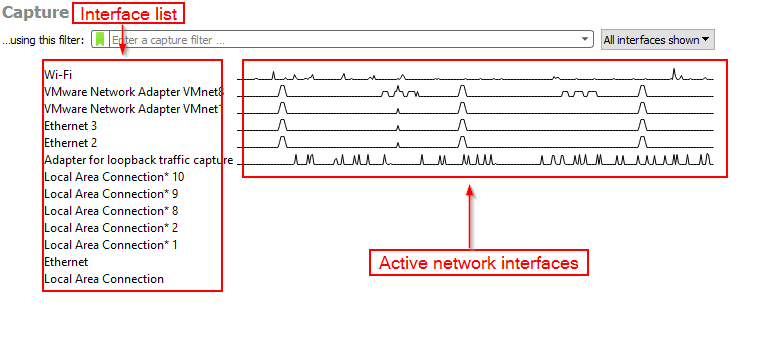
I.e. :- In interfaces as we’re able to see Wi-Fi and Adapter for loopback traffic capture along with other interfaces, on Wi-Fi interface we can monitor the traffic of our connected wifi network and with Adapter for loopback traffic capture we can monitor all the network traffic of our computer including all connected network interfaces,
In wireshark’s main window you can see the list of available network interfaces, from which we can start capturing any interface to monitor the traffic simply by double click on it.

Live capture filters
Wireshark also allows us to apply live capture filters to filter out network traffic in real-time, on main window as we can see an input field which says Enter a capture filter,with help of this we can specify filters on live capturing.

i.e :- we only want to capture http trafic for port 80 then we simply can insert the following filter pattern tcp port http or tcp port 80 inside the box after selecting our desired interface. you can see other default live capture filters by clicking on that green ribbon > manage capture filters. for more information about filters go to the Wireshark Website.

Once you have applied your capture filter, you can begin a capture on an interface by double-clicking the interface or by right-clicking and navigating to Start Capture.
Packet capture window
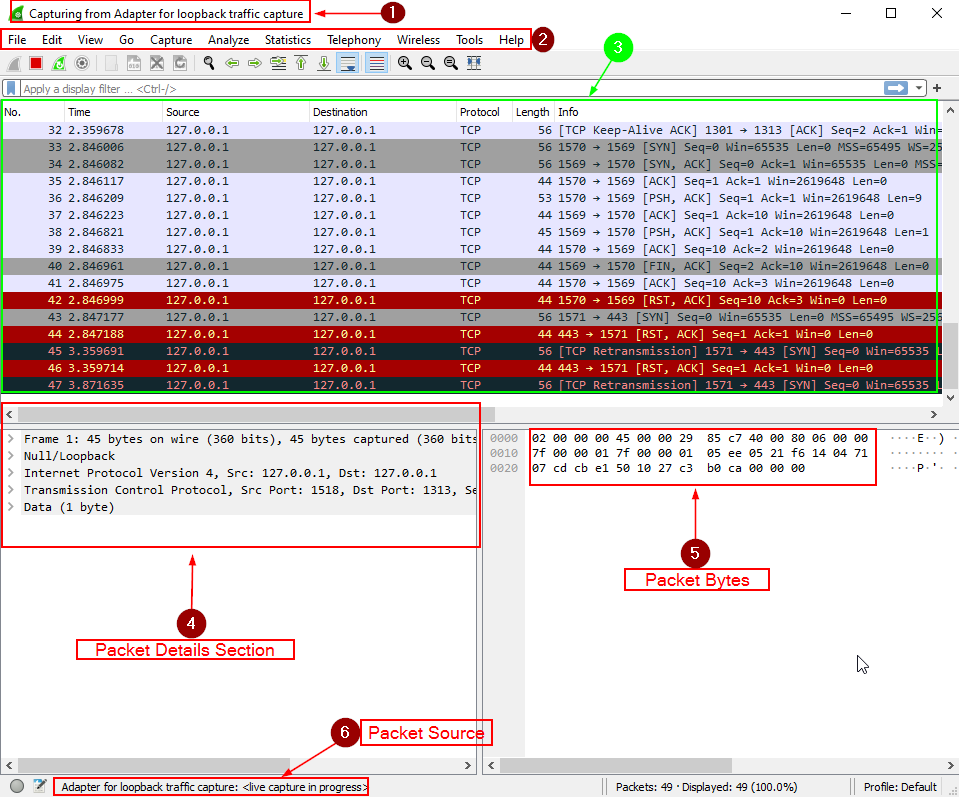
As soon as we start capturing the traffic it will start showing the streaming packets in main window as you can see in image below 👇, it also depends on your network activity.
To understand what’s going on, let’s break down this image.
- This is the network interface on which we’re capturing the packets.
- Wireshark menu, we’ll look into this while analyzing the traffic.
- These are the packets currently streaming in network or in case of pcap file, these will be all captured packets. in this section wireshark gives us some important info about each packet including:
- Packet Number
- Time
- Source IP
- Destination IP
- Protocol
- Length
- Packet Info
- This is the packet details section here we can see all contained information inside of any selected packet, i.e. : source IP, destination IP, layers information, containing data, etc.
- In this section we can see all of the details from packet details section in form of raw bytes and hex
- Details of packet capture source from which this data is being imported.
Along with quick packet information, Wireshark also color codes packets in order of danger level as well as protocol to be able to quickly spot anomalies and protocols in captures.
This quick glance at packet information can be useful to track down exactly what you’re looking for during analysis.
Below the wireshark menu, there are also some buttons with options to start, stop, save, close and navigate the packets.

Collection methods
Understanding PCAP file collection is a prerequisite for analysing protocols in a PCAP. For Wireshark-based capture, the steps are straightforward, but traffic acquisition techniques like taps, mirrors, floods, and ARP poisoning can be interesting and complex. This blog covers only fundamentals.
Begin by starting with a sample capture to ensure that everything is correctly set up and you are successfully capturing traffic, make sure you’ve enough compute power and disk space to handle the number of packets based on size of the network.
Network Taps
Physical implants to physically tap between a cable used by threat hunting or red teams. The two types are inline packet duplication and hardware traffic interception. Examples include the Vampire tap and the Throwing Star LAN tap.
MAC Floods
Red team technique for stressing switches and sniffing traffic. MAC Flooding is intended to stress the switch and fill the CAM table. Once the CAM table is filled the switch will no longer accept new MAC addresses and so in order to keep the network alive, the switch will send out packets to all ports of the switch.
ARP Poisoning
ARP Poisoning is another technique used by red teams to actively sniff packets. By ARP Poisoning you can redirect the traffic from the host(s) to the machine you’re monitoring from. Use with caution despite being less stressful than MAC floods. This technique will not stress network equipment like MAC Flooding however should still be used with caution and only if other techniques like network taps are unavailable.
Filtering Captures
Packet Filtering is like sorting through a big pile of messages, especially when you have a ton of them, even greater than 100,000! In Wireshark Overview we discussed capture filters briefly. There is another type of filters which are more powerful and straightforward. which is called Display filters. There are two ways to use display filters: either by visiting the “analyse” area or by utilizing the filter bar located right at the top where the messages are displayed.
Filtering Operators
Wireshark’s filter syntax can be simple to understand making it easy to get a hold of quickly. To get the most out of these filters you need to have a basic understanding of boolean and logic operators.
Wireshark only has a few that you will need to be familiar with:
and - operator: and / &&
or - operator: or / ||
equals - operator: eq / ==
not equal - operator: ne / !=
greater than - operator: gt / >
less than - operator: lt / <
Wireshark also has a few other operators that go beyond the power of normal logical operators. These operators are the contains, matches, and bitwise_and operators. These operators can be very useful when you have a large capture and need to pinpoint a single packet. They are out of scope for this room however I recommend doing your own research, the Wireshark Filtering Documentation can be a great starting point.
Basic Filtering
Filtering gives us a very large scope of what we can do with the packets, because of this there can be a lot of different filtering syntax options. We will only be covering the very basics in this room such as filtering by IP, protocol, etc.
The syntax of filter commands is very simple and easy to understand, The basic syntax consist of a service or a protocol (such as IP or TCP/UDP) followed by a dot and the particular filter string which we want to filter out (such as MAC, protocol, service, address etc.).
For instance, the ip.addr filter is used when filtering by IP. With this, you may filter through the traffic and see only the packets that contain a specific IP address, whether it’s the source or the destination.
Filtering by IP
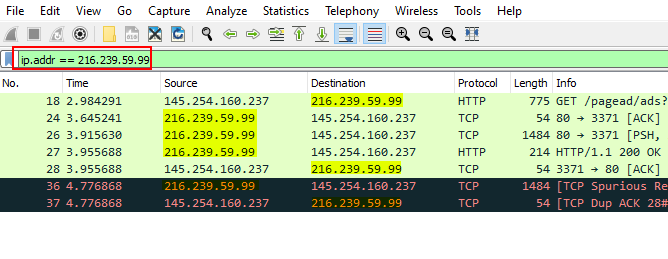
The first filter we will look at is ip.addr, this filter will allow us to filter through the traffic and only see packets with a specific IP address contained in those packets, whether it is the source or destination.
ip.addr == <IP Address>i.e. :- Suppose we want to filter the IP 216.239.59.99, so our syntax will look like this ip.addr == 216.239.59.99
I’m using a sample capture file form wireshark’s website for examples in this section, you can get it from the website, or download it from below 👇.
Download: http.cap
This filter is very useful in practical applications while doing threat hunting, assesment or solving a networking challenge in ctf.
Filtering by SRC and DST
Sometimes you only want to see the traffic in one direction, for instance you’re doing an analysis and want to see only web requests done by a particular source IP to web server’s destination IP. In this case we can use wireshark filter operators we discussed in filtering operators section along with our filter syntax.
ip.src == <SRC IP Address> and ip.dst == <DST IP Address>i.e.:- From our capture file in packet number 4 we know the 145.254.160.237 IP address sending requests to server.

Here a basic understanding of how web and web request/response works will be very helpful to understand.
Now let’s filter all the requests sent by our target IP address 145.254.160.237 to server’s IP 65.208.228.223, so our syntax will look like this:
ip.src == 145.254.160.237 and ip.dst == 65.208.228.223
As you can see in above screenshot all request packets are sorted to src and dst address accordingly.
Filtering by TCP/UDP Protocols
The last filter we will be discussing is the protocol filter. As its name describes, protocol filter allows us to filter services by their protocol it is similiar to using tcp.port filter for that particular protocol.
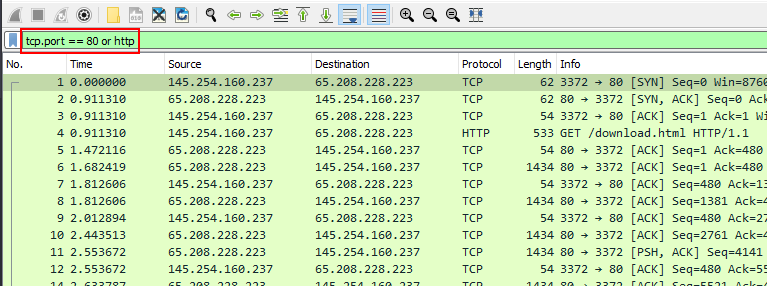
tcp.port == 80 or httpLet’s break this down: the filter tcp.port == 80 checks for packets that are either using this port or any other port associated with the http service. This is because the default port for the HTTP service is 80, but users sometimes choose to use a different port for their HTTP service rather than the default.
Same as TCP we can use UDP filter to filter out packets associated with UDP services with syntax udp.port == PORT or udp_protocol you can also use eq instead ==. for example you want to filter out dns packets from the capture file, to do so you can use following synatx.
udp.port eq 53 or dnsThere’s only two packets associated with dns protocol.
Packet Dissection
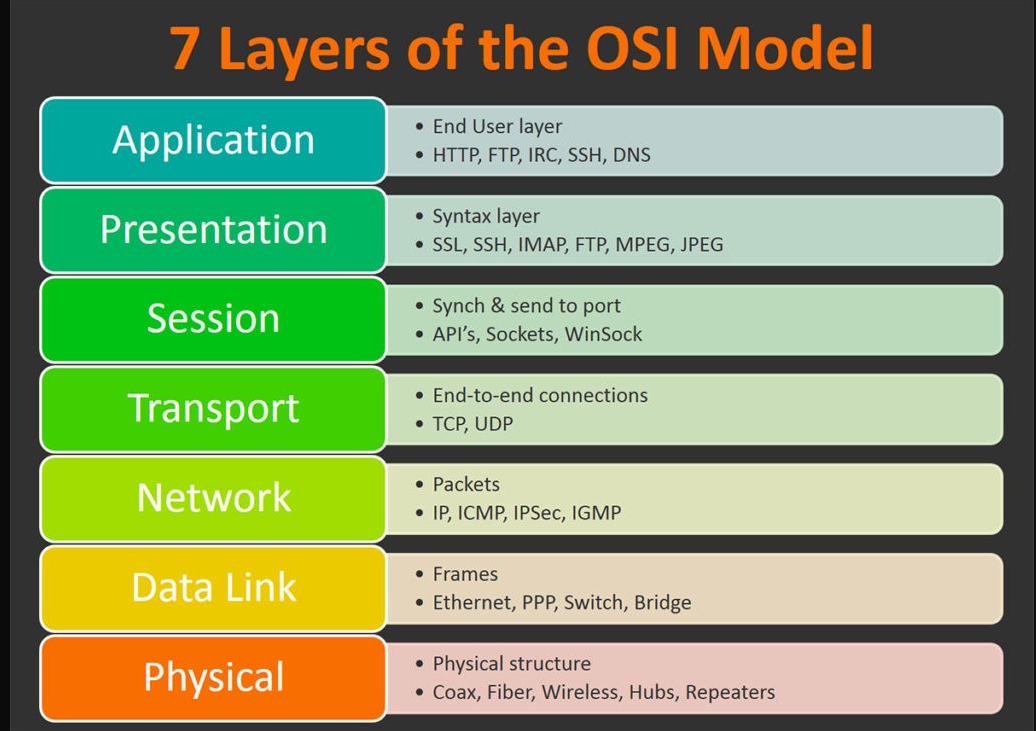
In this section we will understand how wireshark uses OSI layers to break down packets, and how we can use OSI model to analyze the packets. Before we start a good understanding of OSI model and how it’s layers work togather to communicate in network is mandatory.
Packet Details
When you double click on a packet it will open a new window which contains all the details of packet we clicked on. Packets consist of 5 to 7 layers based on OSI model.

Frame (Layer 1: Physical layer)
This will show you what frame / packet you are looking at as well as details specific to the Physical layer of the OSI model.

Source [MAC](Layer 2: Data Link layer)
This will show you the source and destination MAC Addresses; from the Data Link layer of the OSI model.

Source [IP](Layer 3: Network layer)
This will show you the source and destination IPv4 Addresses; from the Network layer of the OSI model.

Protocol (Layer 4: Transport layer)
This will show you details of the protocol used (UDP/TCP) along with source and destination ports; from the Transport layer of the OSI model.

Protocol Errors
This is a continuation of the 4th layer showing specific segments from TCP that needed to be reassembled.

Application Protocol (Layer 5: Application layer)
This will show details specific to the protocol being used such HTTP, FTP, SMB, etc. From the Application layer of the OSI model.

Application Data
This is an extension of layer 5 that can show the application-specific data.

Now that we understand what a general packet is composed of, move on to looking at various application protocols and their specific details.
ARP Traffic
ARP stands for Address Resolution Protocol is a layer 2 (Data Link layer) protocol, which is used to resolve IP address to MAC address in order to communicate with a physical device.
For example in a network Host A wants to communicate with Host B and Host A have the IP address of the Host B.
As an IP address is used to locate a device on a network. But to communicate sender needs to identify the actual device, Which is done by MAC address.
Imagine an IP address as your device’s home address in virtual world, But when devices want to talk to each other, they need something like a personal ID, and that’s the MAC address. Other devices use MAC address to recognize and communicate.
In order to get MAC address of a device, sender needs to send ARP packets in all over network, ARP packets contain request and response message, so ARP packet sent by sender is contains a request message and it called ARP request packet, the receiver device sends ARP reply packet which contains the response message.
so Host A sends ARP request packets in network to all the connected devices. and Host B send back a ARP reply packet.

To identify packets the message header will contain one of two operation codes (Opcode):
- Request (1)
- Reply (2)
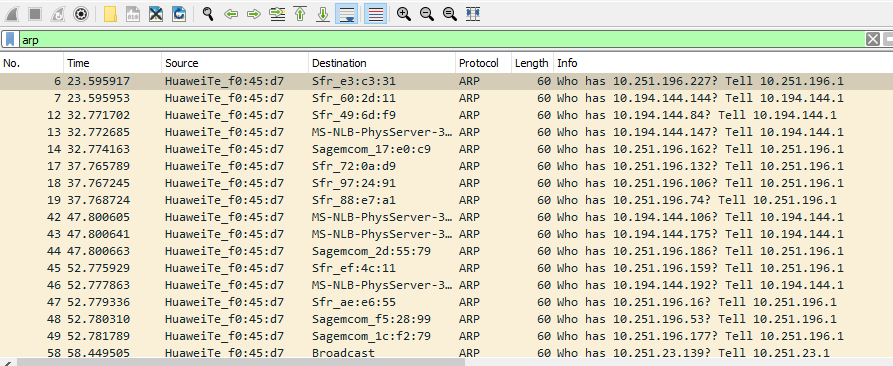
In below image you can see multiple ARP packets.
It is useful to note that most devices will identify themselves or Wireshark will identify it such as HuaweiTe_f0, it makes easy to analyze if there is any suspicious traffic consist with many requests from an unknown source. by default it is enabled in wireshark but if not than to enable this setting within Wireshark to resolve physical addresses. navigate to View > Name Resolution > Ensure that Resolve Physical Addresses is checked.

ARP Traffic Overview
ARP Request Packets
We can begin anakyzing packets by looking at packet details of the first ARP request pakcet using double click on it.
As you can see in the above image Opcode for the packet is 1 which is a request packet, and the target MAC address is all zeros, means it is a broadcast request to all.
ARP Reply Packets
Same as request packet ARP reply packet have Opcode number 2, and other details like MAC and IP address of the sender.

ARP Packet Analysis Practical
Now we know how ARP traffic look like let’s get some hands dirty and do some practical analysis. Download your task file for ARP if you haven’t yet.
Go to packet 6 and double click on it to see packet details.
Ans.: Request (1)
Go to packet 19 and check its packet details.
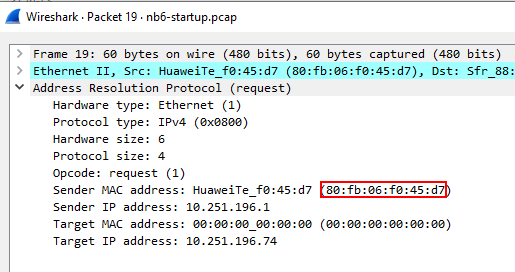 Ans.: 80:fb:06:f0:45:d7
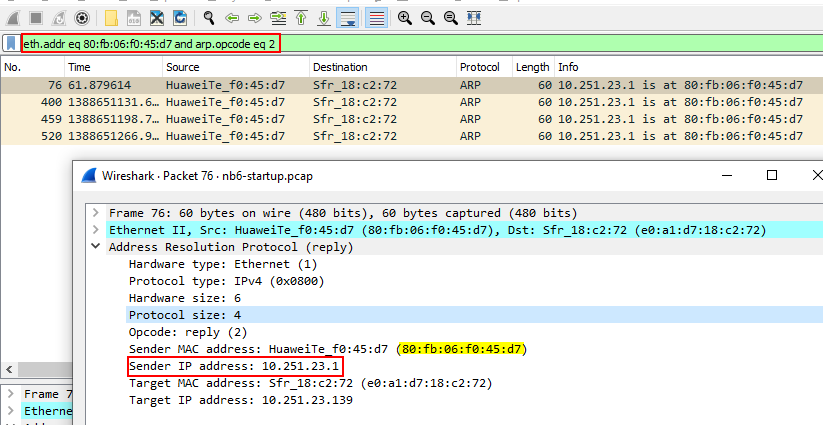
To filter reply packets we can use arp.opcode eq 2 filter pattern.

Ans.: 76,400,459,520
First of all we need to filter out all packets sent via 80:fb:06:f0:45:d7 to do so you can use following filter eth.addr eq 80:fb:06:f0:45:d7. Now as asked we need to find the ip address of the sender, but there are many IP addresses associted with this MAC address. To find actual device we can check ARP reply packets sent back to this device for full ARP conversation. Our final filter pattern will be eth.addr eq 80:fb:06:f0:45:d7 and arp.opcode eq 2 now we got actual device.
Ans.: 10.251.23.1
ICMP Traffic
ICMP Overview
ICMP or Internet Control Message Protocol is used to analyze various nodes on a network. Most commonly used by ping and traceroute/tracert (on windows).
Same as ARP protocol, ICMP also uses request and response packets.
ICMP request and reply
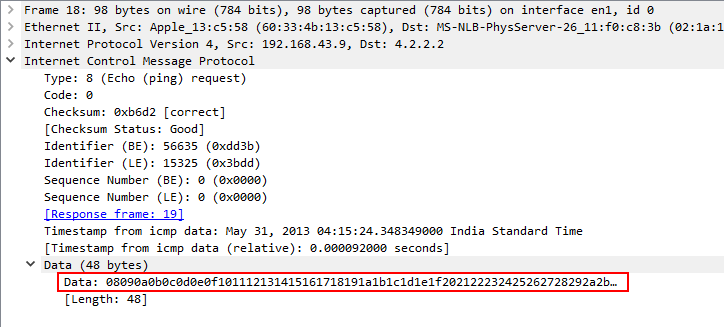
In iCMP request packet there’s two things you need to keep in mind type and its code of the packet, type equals to 8 means its a request packet and if type is equals to 0 that means it is a reply packet, other than that its a suspicious request. timestamp also can be useful to indentify the time and suspicion of ping request.
Here is the example of request and reply packets.
ICMP request packet:

ICMP reply packet:

Practical ICMP Packet Analysis
Answer of the question 4 and 5 is very simple, just open the packet and note the type code.
note: Wireshark bases it’s time off of your devices time zone, if your answer is wrong try one day more or less.

Ans.: May 30, 2013
TCP Traffic
TCP or Transmission Control Protocol manages the delivery, sequencing and errors of packets.
TCP Traffic Overview
TCP protocol uses three-way handshake in order to complete a conversation.
It contains a series of packets: syn, syn-ack and ack packets to establish a successful TCP connection.

SYN packet overview:

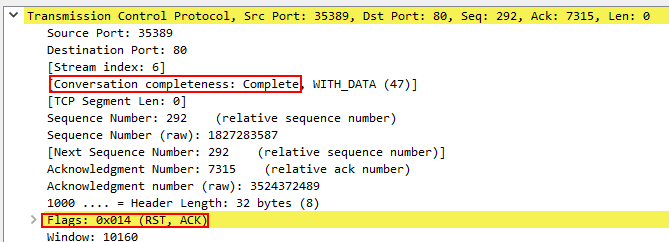
When this handshake is out of order or includes RST packet it marks the conversation as complete and terminate the connection.
If the connection was not complete by sender or receiver than it means there’s something wrong happening in the network.
To understand TCP conversation, we must look at the whole TCP stream rather than checking packets one by one. for that you can go on a TCP packet > right click > follow TCP stream it will show the full TCP conversation stream as below picture.

It seem a http get request is done by this TCP stream.
DNS Traffic
DNS or Domain Name Service protocol is like the telephone directory of the internet. It resolves domain names to their corresponding IP addresses.
There are a few things to keep in mind when analyzing the DNS traffic.
- Query-Response
- DNS-Servers Only
- UDP
If any of these is out of place, the traffic might be suspicious and should undergo investigation.
DNS Traffic Overview
DNS Query and Response
Looking at DNS query we can do some basic checks, Like where the query is originated from. If protocol and port is
- UDP 53 - Pass, its an usual DNS packet.
- TCP 53 - Suspicious, It is not normal to be DNS port 53 with TCP and needs to be investigated.
DNS Query Packet

DNS Answer(Response) Packet
Same as DNS query, DNS response packet contains these information. But additionally it includes an answer that can be used to verify the query.

Practical DNS Packet Analysis
Now we know how DNS traffic work and looks. Download the attached pcap file and let’s start analyzing the DNS traffic.
View details of the packet frame 26 and check DNS query.
Ans.: www.wireshark.org
HTTP Traffic
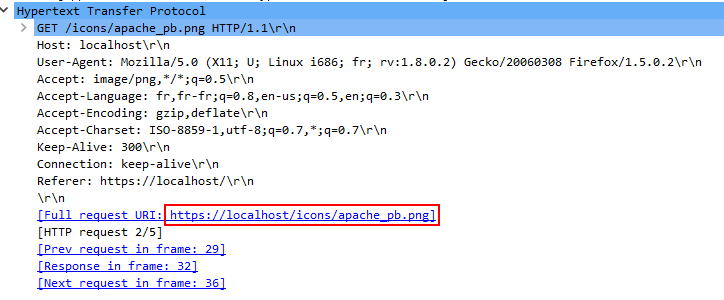
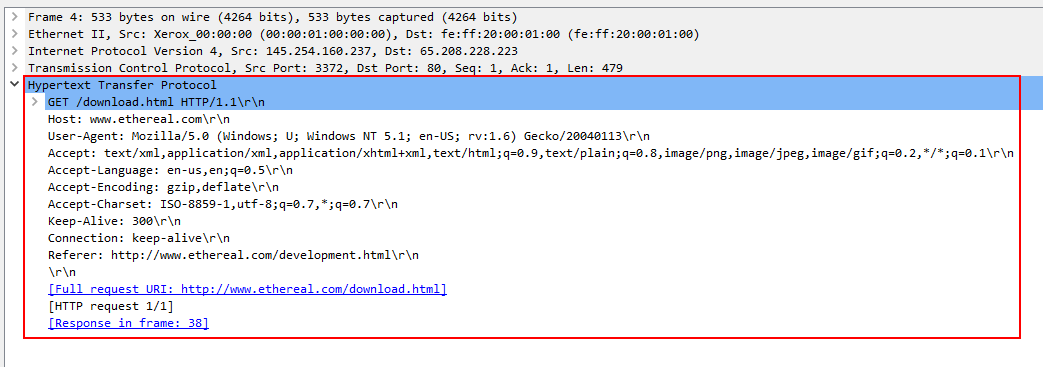
HTTP or Hypertext Transfer Protocol is a commonly used protocol on the internet, its an unencrypted protocol so we can view transfered data in plain text.
HTTP is very simple to analyze, it used to send requests using GET and POST methods to a web server to recieve things like webpages, media files etc.
HTTP Traffic Overview
HTTP is very simple protocol and don’t use any handshake before communicating.
A HTTP packet contains following things: Request Method and URI, Protocol version Request Headers Request Body Response code Response Headers Response Body
From which we can gather some important information like Request URI, Data, Server details etc.
HTTP request packet
HTTP response packet

Practical HTTP Packet Analysis
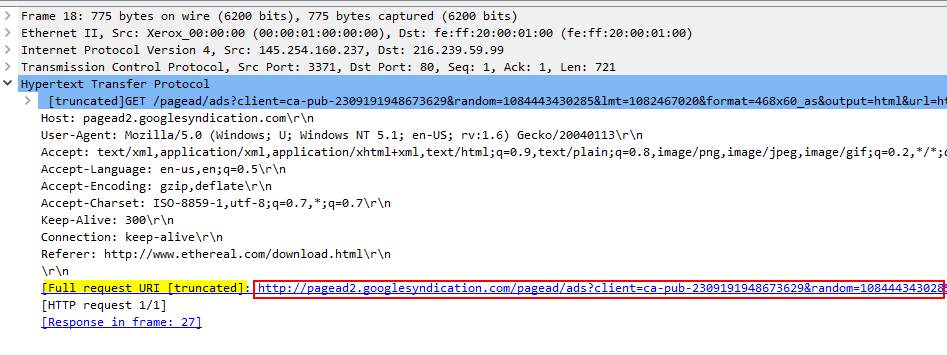
Initially we can gather some basic information from a HTTP packet is the Request URL, method, response, server version, other headers and the post data if sent any.
There are some wireshark features which is very helpful while analyzing HTTP traffic:
Protocol Hierarchy: By using Protocol Hierarchy we can organize all packet details and analyze data in a capture. To access it, go to Statistics > Protocol Hierarchy.
As in above example we can see amount of packets used by protocols, DNS and any other type of transmitted data.
Export HTTP Object: With help of this feature we can organize all requested URIs in the capture and easily find any files if transmitted or any other suspicious activity. To use Export HTTP Object navigate to file > Export Objects > HTTP
Endpoints: To discover wehre a discrepancy is originating from and organize all endpoints and IP addresses found in a capture file. Use this feature by navigating to Statistics > Endpoints.

Go to Statistics > Protocol Heirarchy and check for amount of DNS packets.
Ans.: 4.7
Go to Statistics > Endpoints and check IPv4 tab

Ans.: 145.254.160.237
View packet detail of packet frame 4, User-Agent field under Hypertext Transfer Protocol
Ans.: Mozilla/5.0 (Windows; U; Windows NT 5.1; en-US; rv:1.6) Gecko/20040113\r\n

Ans.: www.ethereal.com
HTTPS Traffic
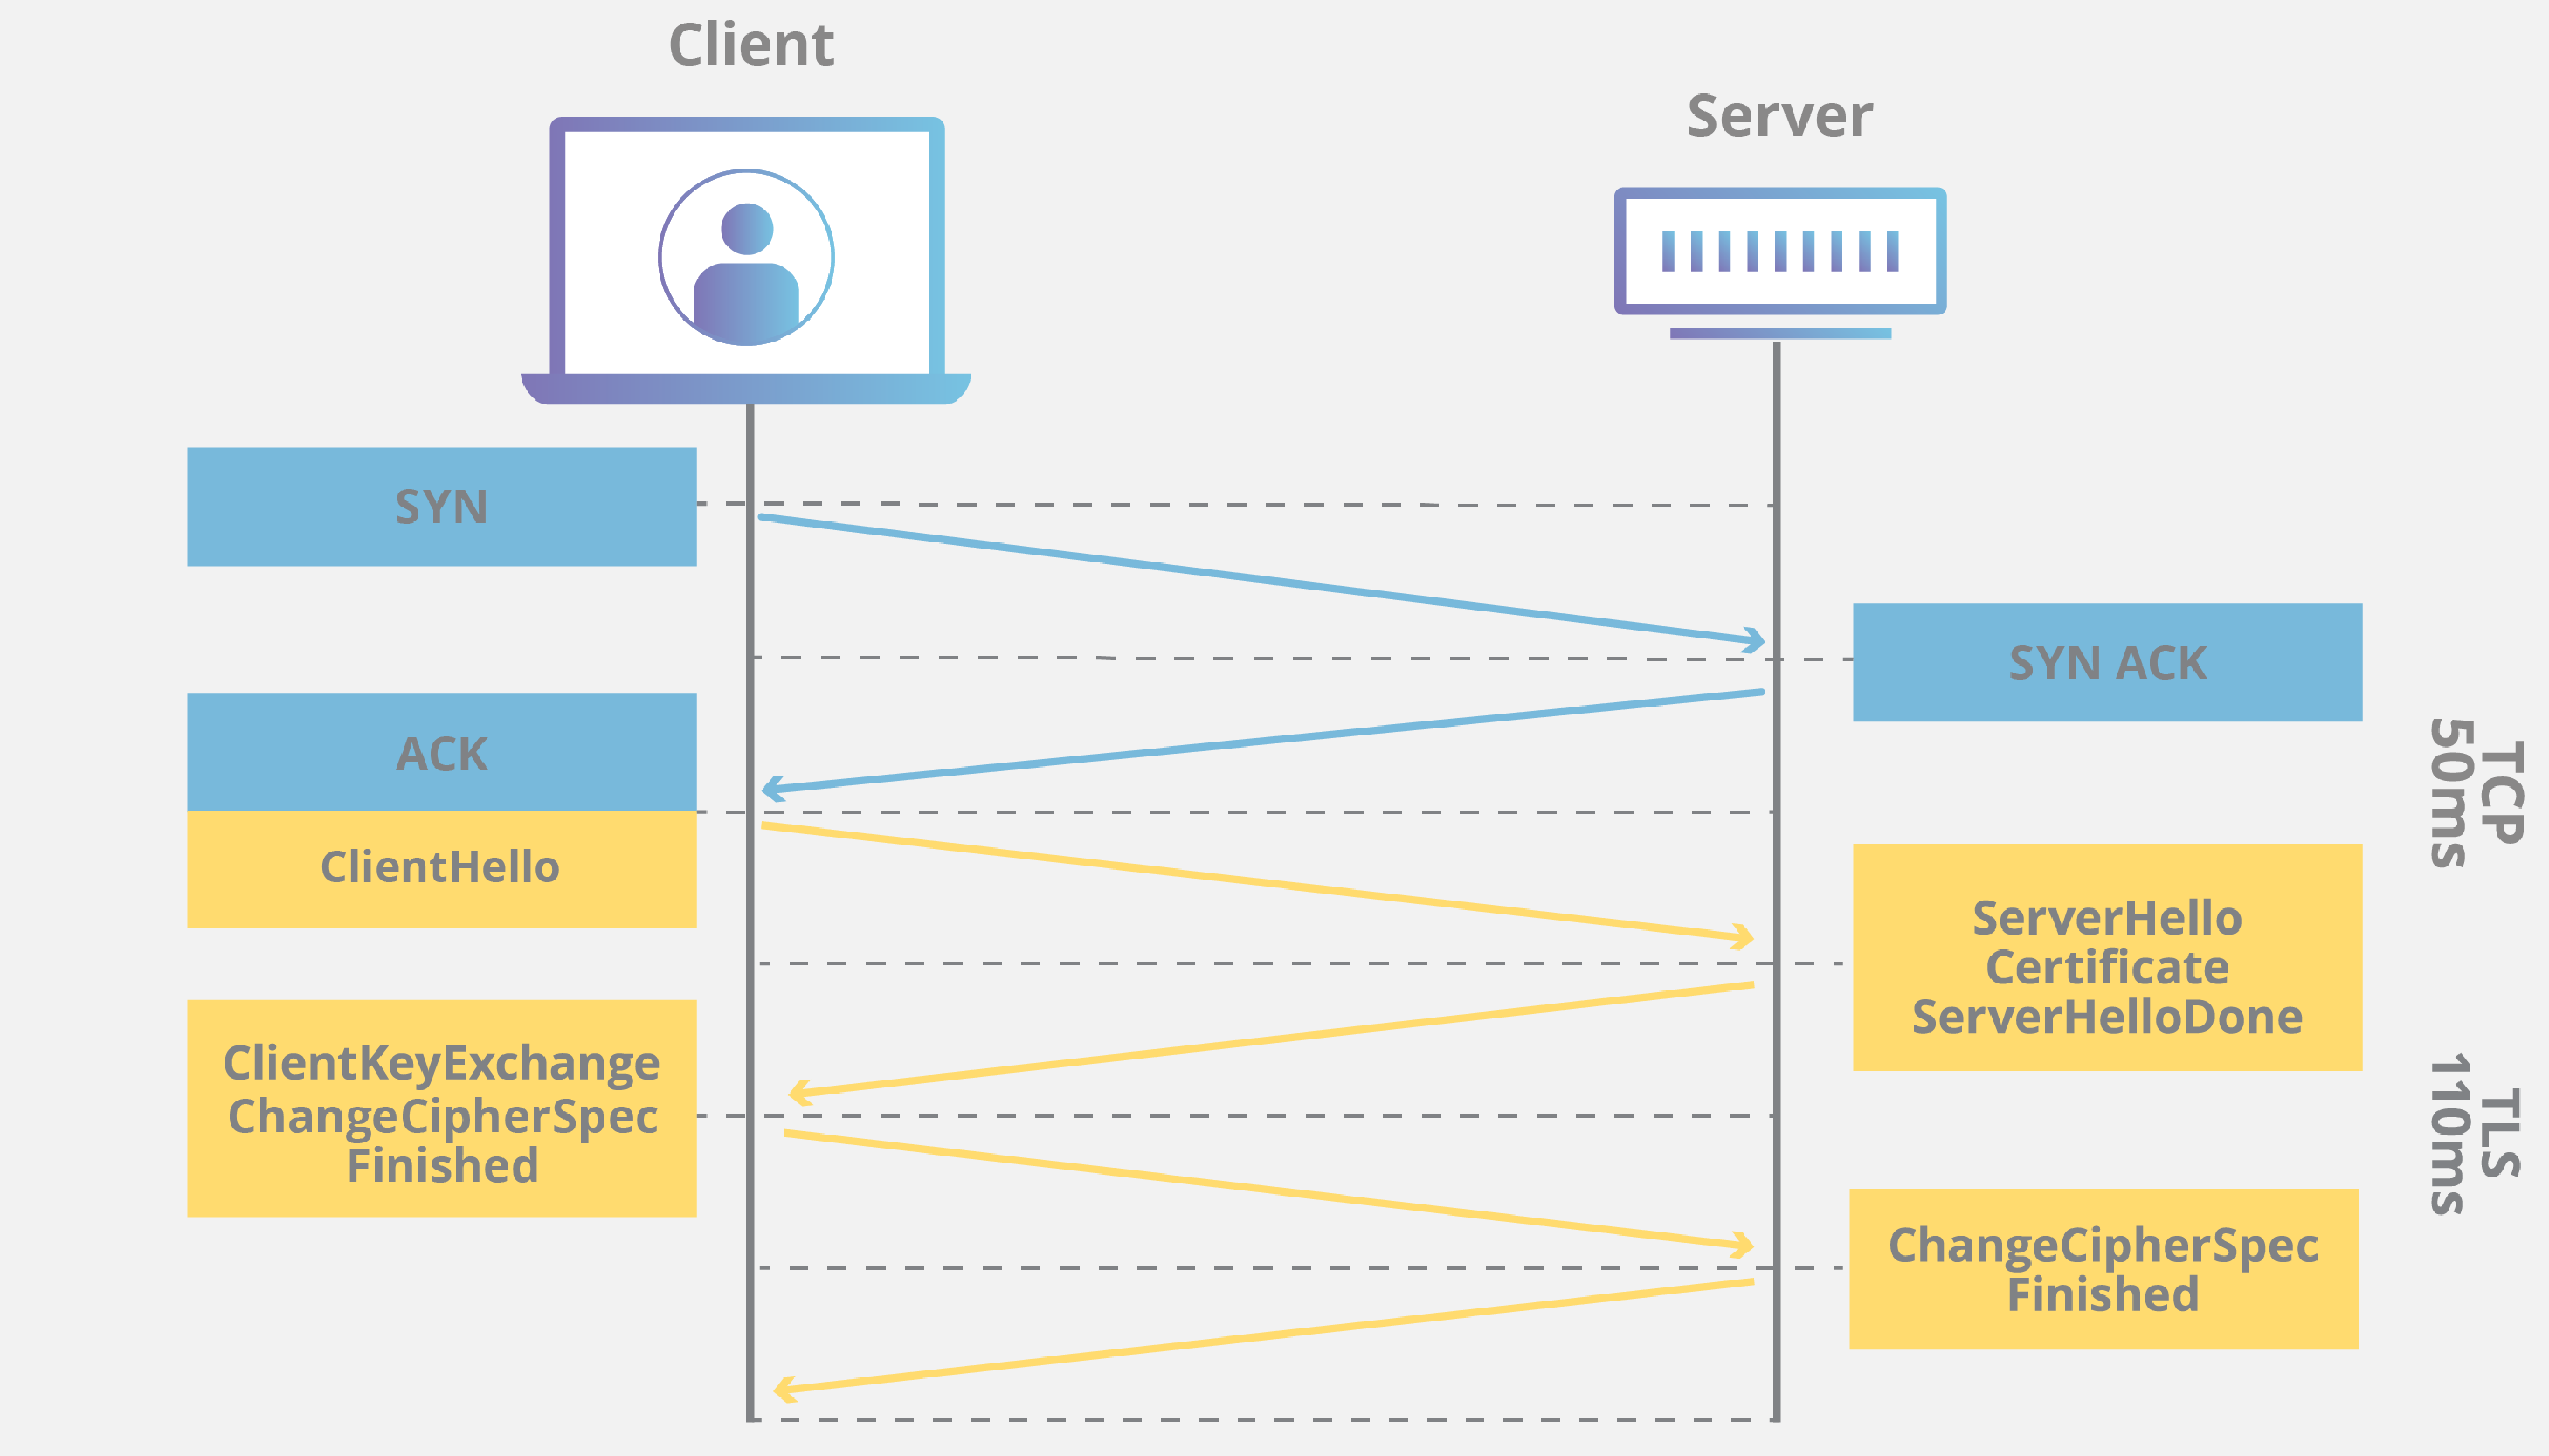
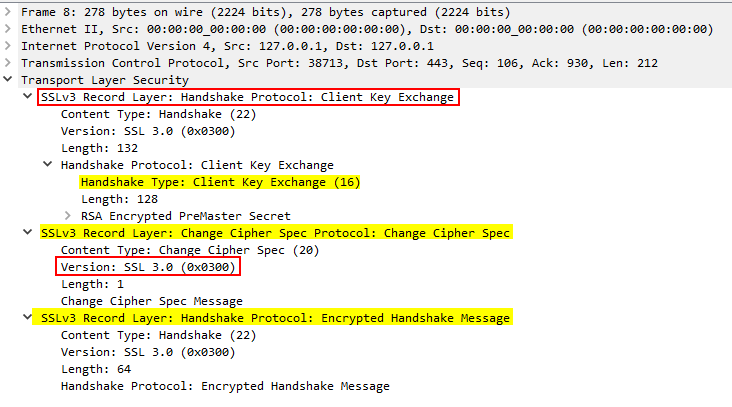
Hypertext Transfer Secure Protocol is secured version of HTTP and comes with encryption. Unlike HTTP it uses handshake between client and server, it is called SSL/TLS Handshake. It is also bit complicated while analyzing HTTPS traffic.
HTTPS Traffic Overview
It follows few checks to make a secure tunnel before sending the encrypted information.
- Client and server agree on protocol version
- Client and server select an encryption algorithm
- Client and server can authenticate to each other (Optional step)
- Creates a secure tunnel with a public and private key pair in order to encrypt and decrypt data by client and server.
Before start analyzing the HTTPS traffic, let’s understand how handshake works for this protocol.
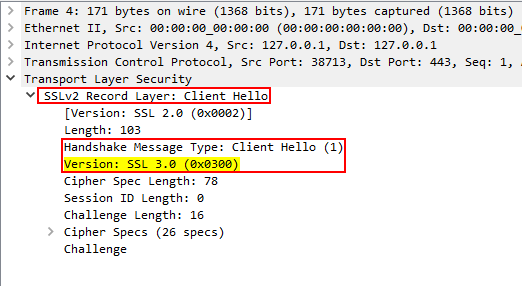
- Client Hello: The client (web browser) initiates a handshake and sends its configuration and a random number.
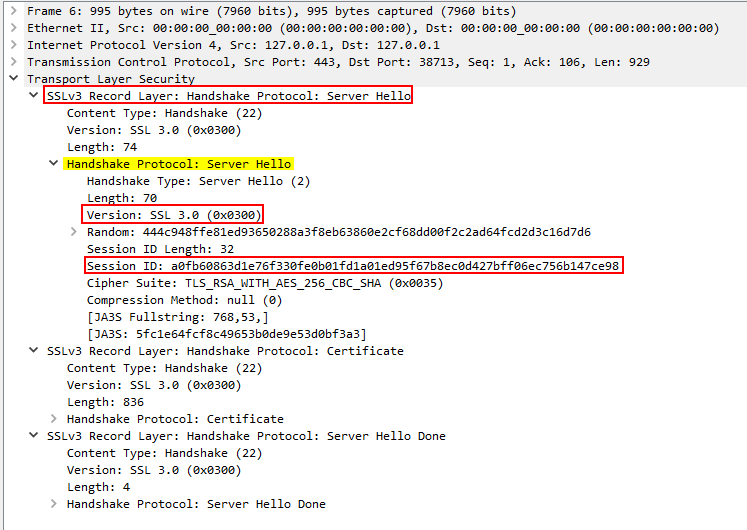
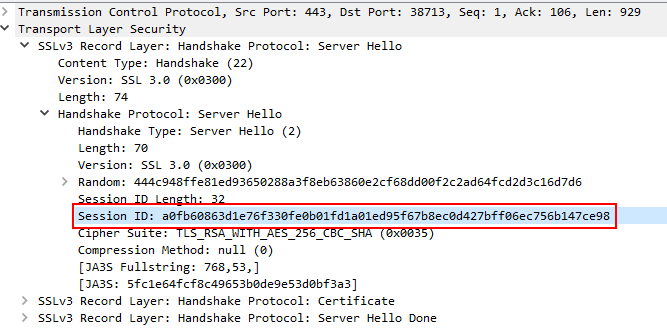
- Server Hello: The server chooses encryption settings and responds by sharing a public key, session ID and a random number.
- Key exchange: The client uses the server’s public key to encrypt the shared secret and sends it back.
- Session Key: Both parties derive a common session key from the data exchanged.

HTTPS handshake session key - Completion message: The client and server exchange acknowledgment messages to verify the integrity of the handshake.

- Secure data exchange: Data can be transferred securely using a shared encryption key.

Secure data exchange
You’ll need the secret key in order to decrypt and analyze HTTPS traffic.
Practical HTTPS Packet Analysis
Download the tasks file, unzip and open snakeoil2_070531.pcap in wireshark.
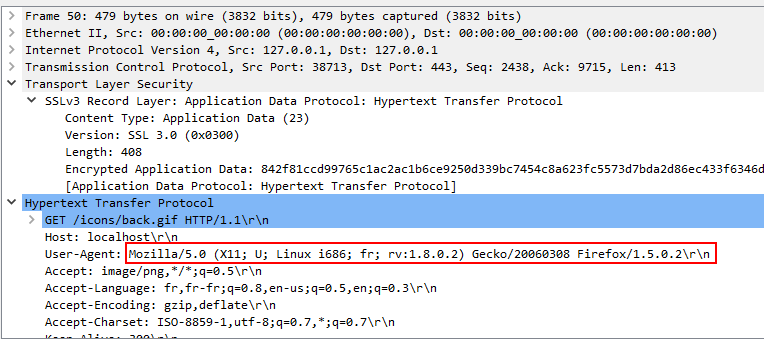
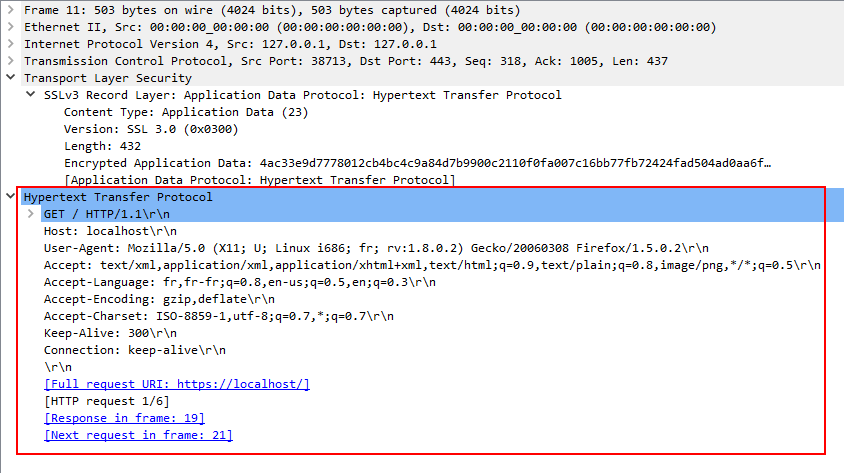
When you click on a packet containing data and see it’s packet details, you will notice that data is encrypted as it should be.

To analyze the traffic we need to decrypt the data, for that you can load the RSA key by navigating to Edit > Preferences > Protocols > TLS > RSA keys list > [+]
Now that we imported the RSA key wireshark automatically decrypted the HTTPS data streams, you can check by navigate back to the packet details.
Analyzing Exploit PCAPs
ZeroLogon PCAP Overview
ZeroLogon: The zerologon or CVE-2020–1472 exploit uses Netlogon Remote Protocol (MS-NRPC), when an attacker uses this protocol on vulnerable target. It esablishes a vulnerable Netlogon channel to Windows Active Directory Domain Controller, attacker can access the domain controller with an elivated privileges. which allows an unauthenticated user to perform tasks with administrator permission. Read more about this ZeroLogon vulnerebility here.
Analysis
Identifying the attacker
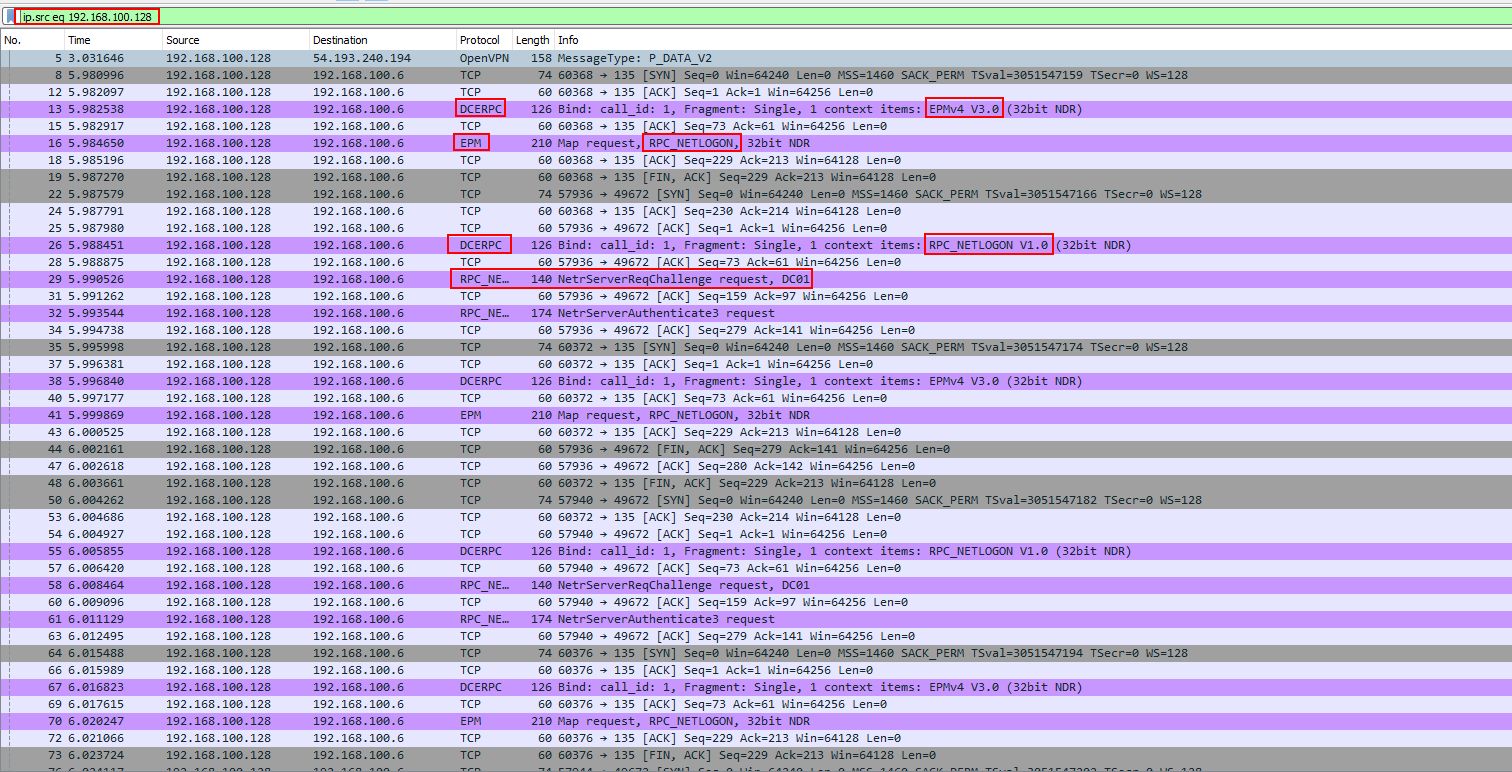
Upon opening the PCAP file, we immediately spot some unusual elements. While there’s standard traffic from OpenVPN and ARP, we also detect unfamiliar protocols like DCERPC and EPM. All these requests originate from 192.168.100.128, indicating it as the potential attacker. Our investigation focuses on examining packets from this IP.
Zerologon POC Connection Analysis
Use ip.src eq 192.168.100.128 filter pattern to filter out the traffic originate from this IP.
While analyzing PCAPs always keep in back of mind what IOCs or Indicators of Compromise particular exploits may have with them.
Secretsdump SMB Analysis
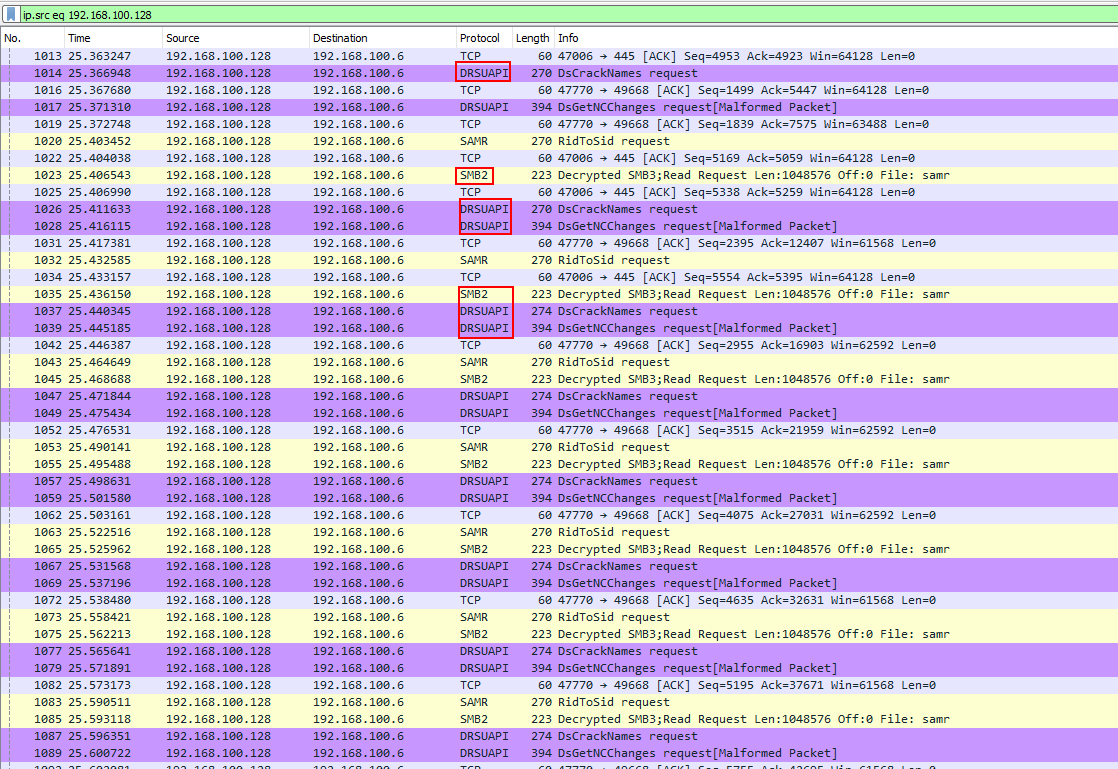
Upon closer inspection of the PCAP, we observe SMB2/3 traffic and DRSUAPI traffic. Secretsdump exploits SMB2/3 and DRSUAPI to dump hashes, so it’s reasonable to conclude that this traffic corresponds to secretsdump.
Each exploit and attack will have its own unique artifacts, it will always makes it clear that what happend and what was the order of the events during the attack was performed.
Once we have identified the attacker we would need to identify and isolate the incident as well report it if we were on a Threat Hunting team.
CONCLUSION
I hope you enjoyed reading this blog post and found it both informative and engaging. Despite its length, we have gained valuable insights into the world of network analysis using Wireshark. This powerful tool allows us to thoroughly examine network traffic, detect anomalies, and strengthen our cybersecurity skills. By completing TryHackMe’s introductory room on Wireshark, we have established a strong foundation for understanding and securing networks. In today’s digital age where effective communication is crucial, Wireshark’s capabilities are truly invaluable, making it an essential asset for anyone working in this field. Thank you for being here :)
